
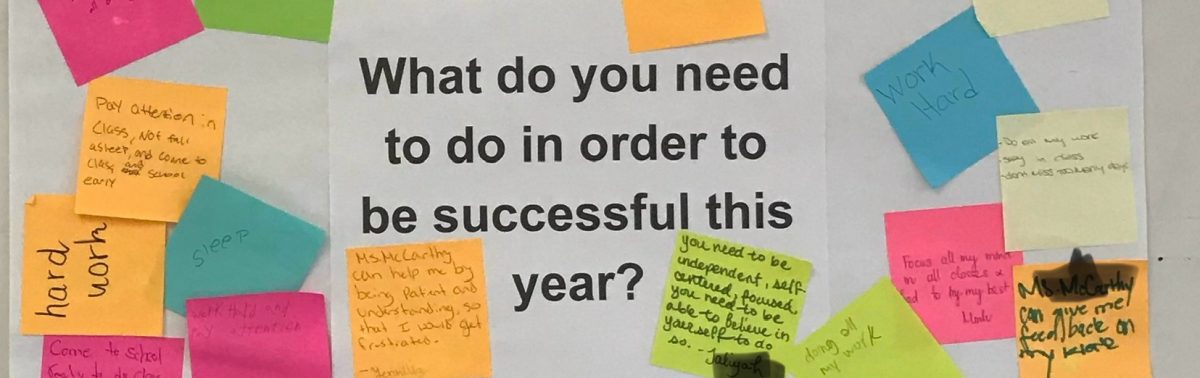

Looking for ways to launch a new unit or text, leverage prior knowledge, create community, and showcase thinking? Here it is: The Consensogram–a visual learning strategy where students create a bar graph of their thinking. I use it as a unit opener, offering students the unit’s essential questions and themes as debatable statements. Together, as a class community, their individual perspectives on these debatable claims form a “Consensus” in the form a visual bar graph. The Consensogram is a powerful tool that can be used as a unit opener or launch of a new text. It can also be used as a formative check for understanding mid-unit. I’m always searching for a novel way to facilitate immersive learning with the goal of taking the work “off the page,” and the Consensogram does just that. It adds a new layer of depth and engagement to the traditional “anticipation guide,” and it can be used effectively to facilitate discussions and debates.
Understanding The Consensogram


It’s a different way to stimulate thinking, create discussions, and engage students effectively. One of the unique aspects of the Consensogram is the way it can be used to visualize and analyze thinking as data. It encourages peer questioning, whole class discussions, and even Socratic Seminars. The final product can be displayed throughout the text or unit of study, and can be referred back as the class works through essential questions and develops themes. As an added bonus, it catches the eye and interest of the room. At the end of the unit, students can return to the Consensogram to compare their agreements and disagreements as a reflection of how their thinking and understanding of unit themes and concepts have evolved.
The Consensogram can also be used anytime you want students to think about their stance on a topic. All you have to do is choose at least 2 debatable claims, evidence, or ideas for students to think about and apply to their own beliefs.
Implementing the Consensogram: What You Need
The set up is worth it! Here’s a guideline to help you get started:
- Choose 5-8 debatable statements, ideas, or claims related to the text or unit’s universal ideas, themes, and essential questions.
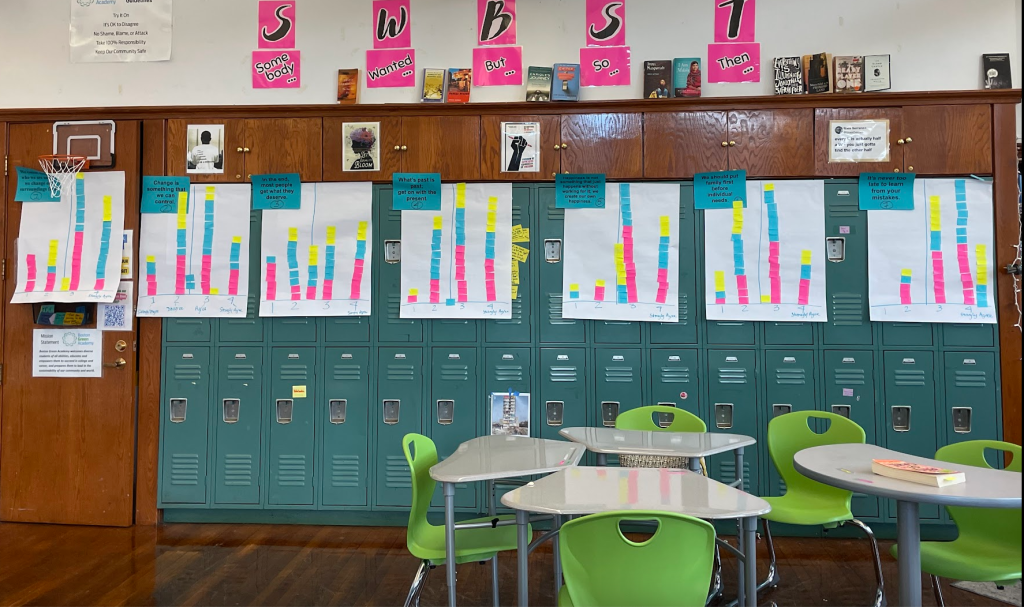
- Print each statement in large text on a piece of chart paper and tape it to the top. Draw a line down the center of the chart paper in marker and draw a horizontal line at the bottom. Write the numbers 1, 2, 3, and 4 under the bottom horizontal line with numbers 4 and 3 to the left of the vertical line and 1-2 to the right.
- Prepare small sticky notes, ideally 1×1. Use a different color for each class to help students analyze data across classes the next day.
- Each student receives the number of sticky notes matching the number of claims or posters. If there are 8 claims, each student will receive 8 sticky notes.
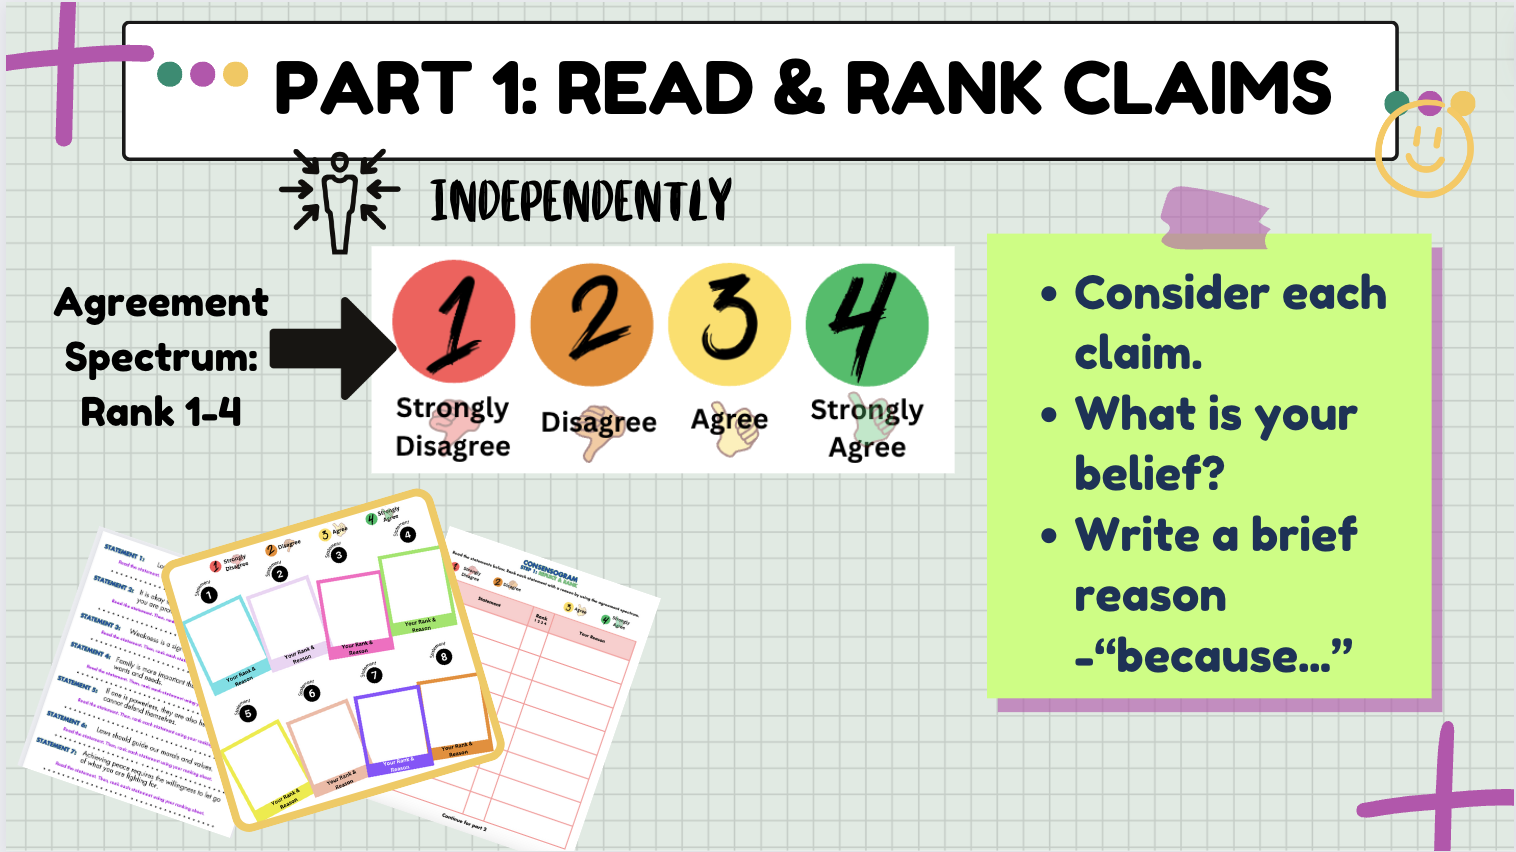
- Ensure the numbers (1-4) you are using on the agreement spectrum (1=strongly disagree, 2=disagree, 3=agree, 4=strongly agree) match the numbers on your chart paper.

Immersive learning takes set up, but the pay-off is student engagement.
Step 1: Reflect and Rank Debatable Claims
One of the reasons I am a Consensogram fan is that it leverages students’ prior knowledge, allowing the space to jump in with their own belief system. There are several ways you can facilitate this first step:
One option is to use a traditional “Anticipation Guide,” where the debatable claims are printed on the guide and students indicate their level of agreement using a scale from 1 to 4, ranging from strongly disagree to strongly agree. Students can complete the Anticipation Guide with or without providing reasoning for their beliefs.

Alternatively, you can provide the claims separately on paper or project them. I am a manipulatives person, so I cut the eight claims into laminated slips for each student and re-use for all of my classes. That way, I can even save them for next year when I introduce the unit again. Students think about each claim and record their level of agreement and reasoning in picture frames. This simple change from the traditional Anticipation Guide adds a bit of novelty, and for my students, novelty equals higher engagement.
Step 2: Add Sticky Notes to Chart Papers

Once students have ranked the claims, they add their sticky notes to chart papers according to their level of agreement. For example, if a student selected 2 (disagree) for statement #3, they would go to the chart paper labeled with the claim and number “3” and add a sticky note above the horizontal line belonging to “2 – Disagree.”
Remind students to place the sticky notes vertically and not to cover anyone else’s note. By using a different color sticky note for each of your classes you can track class trends and dig deeper into the data your students create. Tip: ask each student to write their initials on the note to track engagement.
Step 3: Partner Discussions
Next, students find a partner and work through discussion cards. These cards are adaptable for any activity and can be laminated for reuse throughout the year. The partner work provides a helpful scaffold to the Socratic Seminar or whole-class discussion in Step 4, allowing quieter students to problem solve and process 1:1.

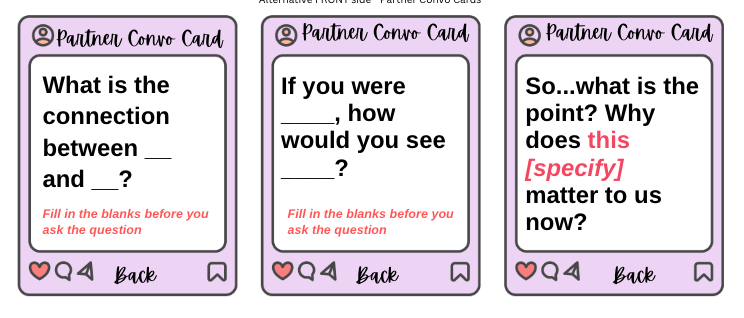
In my Consensogram resource, I provide two different discussion card sets. One version of the cards has students work through questions with the same partner. Another version of the cards has only one question on the card: students ask and answer each other’s question, then trade cards before finding a new partner and a new question to discuss.
Step 4: Circle Discussion or Socratic Seminar
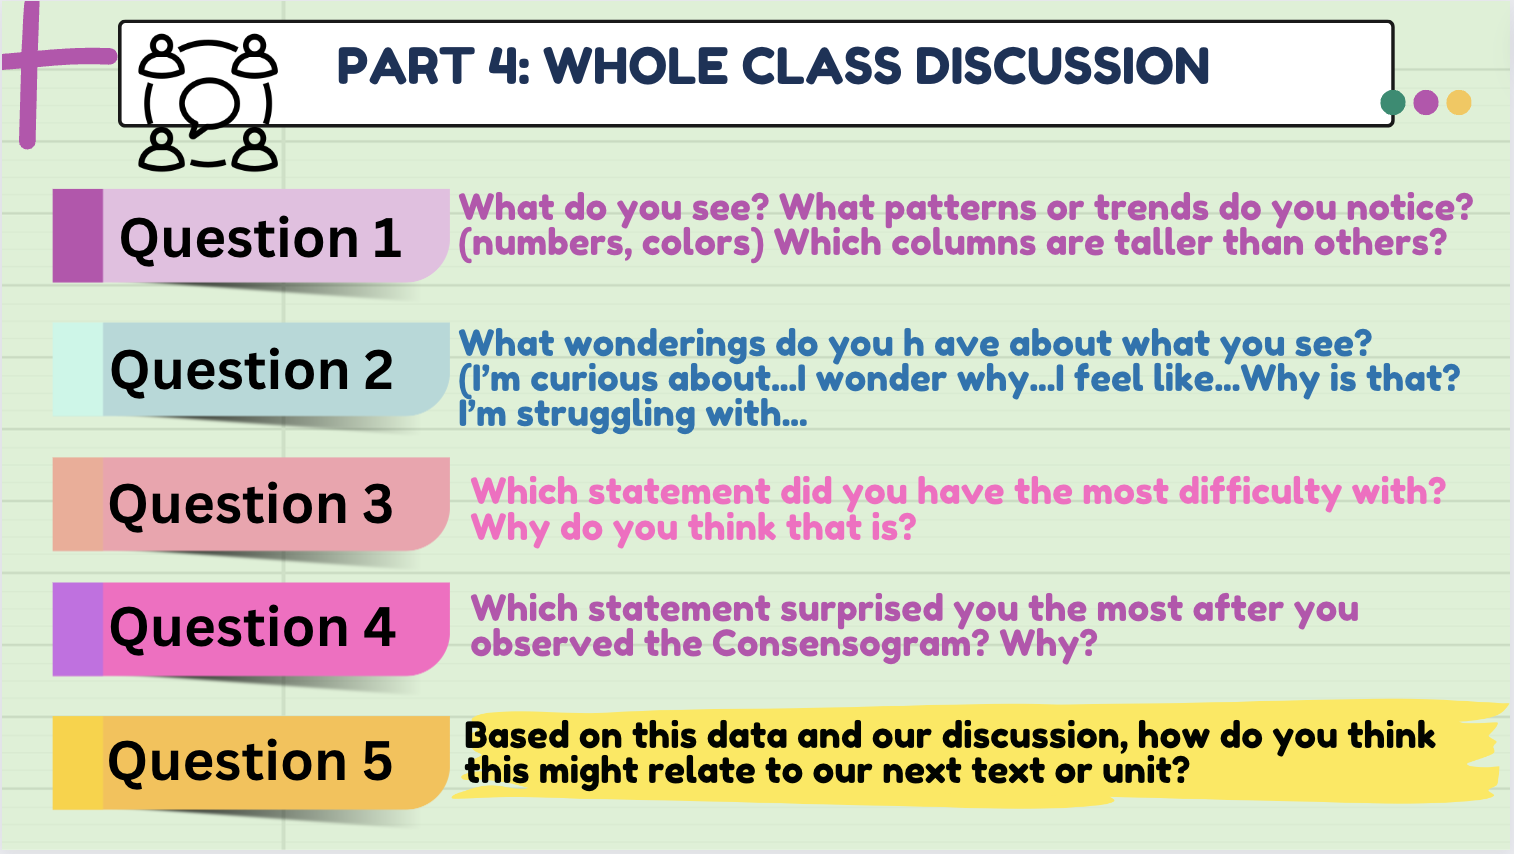
Finally, students gather together for a circle discussion or Socratic Seminar, working through the five questions on the activity handout. The whole-class discussion questions are designed to move students through higher DoK questioning from “What do you notice?” to “What might trends in our thinking or points of disagreement/agreement mean?” to “What are the implications of this data?”

Encourage students to notice and talk about their Consensogram as collected data representative of their shared belief system and different perspectives within your class community. Students walk away with making connections between the evidence/data and synthesizing the class’ collective responses and with even more questions and excitement as we start new learning.
So, next time you’re looking for a novel way to get your students thinking, consider trying out the Consensogram. Happy teaching!
